What if you can create the customized reports in Google Analytics, generated as per custom dimensions (city, browser, etc.) and metrics (Sessions, Bounce Rate, Page Views, etc.)?
Simple, you will be having more control of your website traffic, lead generation, and finally the conversions.
How!
Through, Google Analytics Custom Reports.. You can think of this report as a database center where you can see all the crucial information, that’s really important for your business, at one common place, without having to shuffle between multiple reports.
Here is what you can expect from Custom Reports.
- It offers an innovative way to review and analyze the data as per custom dimensions and metrics.
- It allows you to create and schedule custom automated email reports.
- Hassle-free Custom Report creation without having to work out on the visuals.
Wondering how to do that! Well, you can start harnessing the power of Google Analytics Custom Report by taking help from SEO services experts. We will help you closely understand your customers through detailed reporting and provide some powerful insights. Have a look below to check our Custom Report creation blueprint.
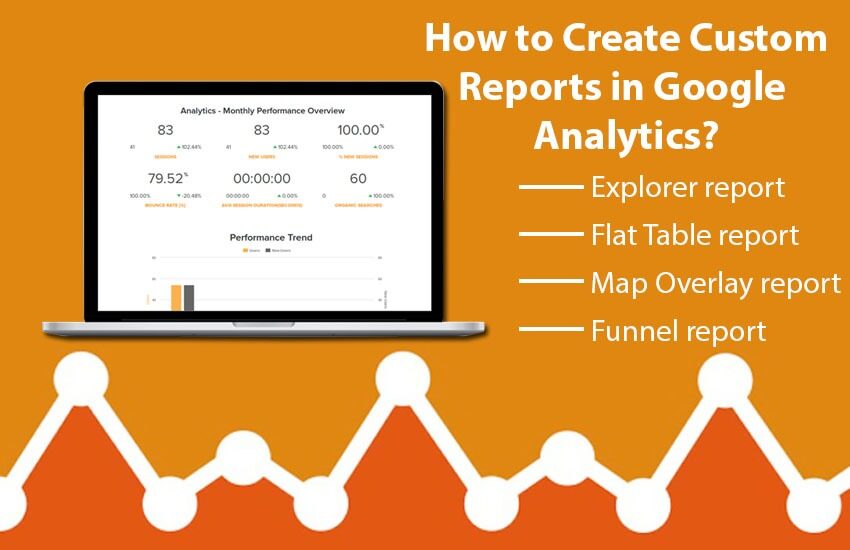
Steps to Create Google Analytics Custom Report
Step 1. Create a New Custom Report
To create a new Custom Report you will have to log in to your Google Analytics account and certainly remember the username and password. Moreover, if you have already created the report, but want to edit it, Google Analytics allows you to do that as well.
Let’s begin with creating the report first.
- First of all, login to your Google Analytics account.
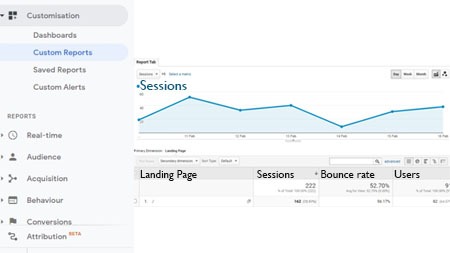
- On the left-hand navigation bar, click Customization and click Custom Reports in the expanded list.
- Now click + New Custom Report.
- Now you should name the Google Analytics Custom Report to distinguish one report from another.
If you just want to modify an existing report, you will need to visit the report, move your cursor to the top-right corner and click Edit. Now modify the Custom Report with the desired alterations.
Step 2. Select the Custom Report Type
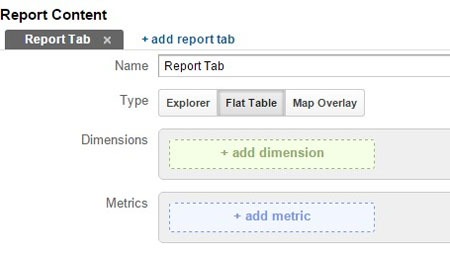
After creating the Custom Report, you have to choose the Custom Report type. Moreover, you will be required to add a tab to the Custom Report and each tab can have a different report type. Here are different Custom Report types and their functionalities.
Type 1. Explorer report (Standard Analytics report)
Also known as the standard analytics report is a generic document that you can use in Google Analytics. It consists of the data table and line graph which comes inclusive of dynamic elements, dimensions, and a series of metrics.
Type 2. Flat Table report
The Flat Table is a static one and it consists of a sortable table to display data in a row. This reporting type sorts the data for unique combinations of up to 5 dimensions against the metrics of your choice.
Type 3. Map Overlay report
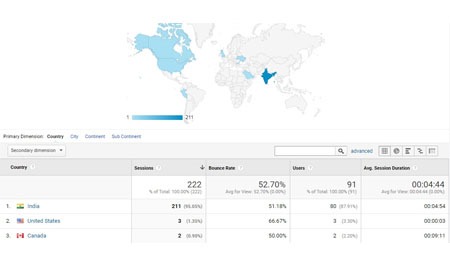
It displays the map of the region with darker areas signifying the traffic footfall and site engagement volume. It makes geographical analysis quite simple and helps in quick monitoring of SEO KPIs within a region, country, or the world.
Type 4. Funnel report
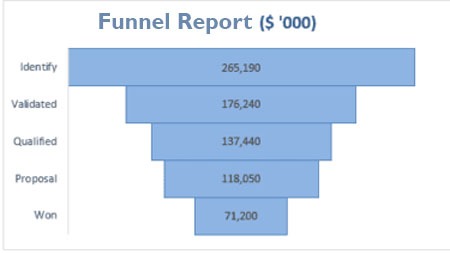
With Funnel report you can get comprehensive custom reports to analyze the performance.
Step 3. Define the Analytics Report Metrics
The next step is to choose the metrics from the list of options depending on which Custom Report type you want. Those metrics will actually define the data that is going to be included in the report.
These metrics could be Refinements, Average Session Duration, Average time on page, Average time on screen, Bounce rate, Bounces, Exits, Hits, etc. You simply have to click the + Add metric group and choose the metric that you want to add.
You can delve deeper into metrics by clicking on + Add dimension and choose the required parameter for which you want to see the report.
Step 4. Add a Filter
Lastly, you can add the filter to your report to limit what appears in it. Let’s say, for instance, you want to see the report for a particular Browser Version, then just add browser dimension in Include filter while adding your preferred browser name (Chrome, Internet Explorer, Firefox) in the Exact match filter. This will make you create a report for that particular browser and exclude others.
Finally, you may choose the location where the Custom Report should appear. Click Save and it’s done. Now you can see the Google Analytics Custom Report by navigating to Customization and clicking over the Custom Reports.
Getting a Custom Google Analytics Report help in several ways. The instructions in this guide would help you to deliver significant results in terms of good traffic and an increase in lead conversions. For any assistance, you may contact our Professional SEO services team and get guidance on creating the Google Analytics Custom Report.